Table of contents
- Interactive accident atlas Accident sites made visible
- Data from 15 federal states shown
- Users can make their own selection
- Accident evaluation accurate to the day

Destatis, artist
counselor
traffic & business
Interactive accident atlas Federal Statistical Office
Interactive accident atlas
Accident sites made visible
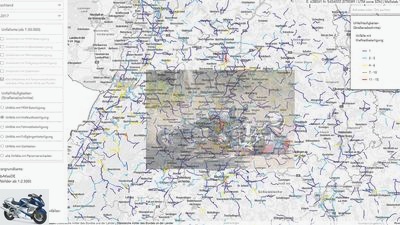
Where did accidents occur? Who was involved? Where are the main accident areas? The interactive accident atlas of the Federal Statistical Office, which has now been expanded to include other federal states, answers these and many other questions.
Uli Baumann
07/28/2020
The interactive accident atlas was launched in 2017, and for 2019 it was expanded to include the federal states of North Rhine-Westphalia and Thuringia as well as data from 2018 and 2019.
Data from 15 federal states shown
But where do most of the traffic accidents happen? On which routes am I particularly at risk? Which intersections or motorway sections are particularly prone to accidents? Where have there been accidents with road deaths? Were cars, motorcycles, bicycles or pedestrians involved in the accident? All this shows the accident atlas published by the statisticians .
the Accident atlas contains data from the statistics of road traffic accidents for the years 2016 to 2019, which are based on reports from the police stations. The exact details of the accident location (geographic coordinates) are recorded by the police when the accident is recorded. The point in time from when the geographic coordinates are collected differs between the individual federal states. Therefore, not all federal states can be shown for all years in the accident atlas. At the start in September 2018, the atlas only contained the accident data from nine federal states (Baden-Wurttemberg, Bavaria, Bremen, Hamburg, Hesse, Lower Saxony, Saxony, Saxony-Anhalt and Schleswig-Holstein). In December 2018, data from the federal states of Brandenburg, Rhineland-Palatinate and Saarland were also added. With the update in July 2020, the accident data from the federal states of North Rhine-Westphalia and Thuringia will also be incorporated. The next update in summer 2021 is expected to add the missing accident data from Mecklenburg-Western Pomerania.
Users can make their own selection
For the first time in this interactive map Accidents with personal injury made visible according to road sections and individual accident sites. Accidents that only resulted in property damage were not integrated. Users can choose whether to display all accidents or only accidents involving certain means of transport. A supplementary table contains additional information – for example, whether it is an accident with road fatalities, seriously injured or slightly injured.
Accident evaluation accurate to the day
The newly published one provides information on accident events by days Accident calendar. This shows, for example, seasonal fluctuations in the number of road deaths, but also in bicycle and motorcycle accidents. It also clearly shows that accidents under the influence of alcohol are related to the course of the week and to certain (public) days.
Related articles
-
Road traffic accident statistics – more dead and injured in 2018
fact.de counselor traffic & business Road traffic accident statistics – more dead and injured in 2018 Road traffic accident statistics More dead and…
-
Motorcycle accident statistics 2019: Risk of death four times as high
Jens Moller-Tollner. 6th pictures Federal Office of Statistics 1/6 Accidents involving motorcycles and bicycles in road accidents, 2019, in percent….
-
Motorcycle accident, rope assassination attempt
Sdun counselor traffic & business Motorcycle accident, rope assassination attempt Rope assassination: an accident and its history “No public interest” A…
-
Traffic accident statistics 2016
Federal Office of Statistics counselor traffic & business Traffic accident statistics 2016 Traffic accident statistics 2016 More accidents, fewer deaths…
-
Accident abroad: how do I get my rights?
counselor traffic & business Accident abroad: How do I get my rights? Accident abroad: How do I get my rights? Accident abroad: How do I get my rights?…
-
Moped driving license from 15: all federal states included
Derbi counselor traffic & business Moped driving license from 15: all federal states included Moped driving license from 15 A year early moped for…
-
Ruroc Atlas 3.0: 16 new decors and 9 visors
Ruroc 14th pictures Ruroc 1/14 “Reaper” is the name of this decor for the Ruroc Atlas 3.0. That means something like “Reaper”. Ruroc 2/14 The decor wants…
-
to travel Accident abroad Accident abroad Oh cheek A crash abroad is probably at the top of the horror list for most bikers. But there are tips on how to…
-
Despite Federal Council initiative: Scheuer rejects further restrictions
Motorcycle noise Debate about the volume of motorcycles Jorg Kunstle, Bruitparif.fr. counselor traffic & business Despite Federal Council initiative:…
-
Pikes Peak Crash – Carlin Dunne had a fatal accident on a Ducati
Ducati 5 pictures Ducati 1/5 The three-time Pikes Peak Champion Carlin Dunne had a fatal accident. Ducati 2/5 Carlin Dunne on the Ducati Streetfighter V4…